![[Image of Linux]](../only5kbytes.jpg)
![[Image of Linux]](../only5kbytes.jpg)
|
The Personal Web Pages of Chris X. Edwardsgradu - Graphics Dump |
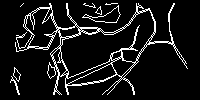
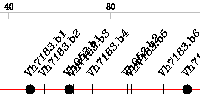
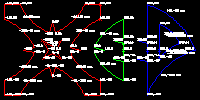
![]() Some example output:
Some example output:

|
|
|

|

|
|
The libplot library contained exactly the functionality I was looking for, but I couldn't find a program that put it to use in a general way. I'm sure opinions vary, but I believe that a program like "graph" should be two parts. One part to calculate where all the lines of a particular graph are and another part to actually plot it. gradu is an attempt to be this second stage.
With gradu, a user has most of the functionality of the libplot library without either having to write their own C program, or circumventing the intent of a program like "graph" to get unorthodox results.
A program could be written that generated graphs and then fed the geometry data to gradu. I'll leave that for someone else. Another example is the follow up program I wrote, vmaster, which takes 3d data sets and evaluates them to 2d data sets. By piping vmaster's output to gradu, one can input a stream of 3d vector geometry and see an image as a result. All of this is inspired by the very modular Unix way of doing business.
One of the keys to the flexibility is the parsing routine. The general strategy is that characters that aren't relevant get replaced with spaces and spaces are the delimiters. This means that whatever crazy syntax your input may have, there probably isn't a lot that needs to be done with it to make it work out. Certainly a quick visit to the sed command should be able to cure any problems.
The libplot library is pretty elaborate. There are a lot of fancy features. This required that the data be able to specify commands for various fancy operations. These single letter commands can be placed anywhere in the input line. The numeric values supplied, if any, will of course need to be in the correct order, but this really provides a huge degree of flexibility.
Data can be specified as files on the command line or piped in using the finest Unix traditions. Default output produces an X window with the data plotted. When making output files such as postscript or gifs, simply redirect output to the desired file name using the Unix ">".
It is only 18kB and includes some simple example data.
Also, you can check out the capabilities of gradu by looking at the html man page for gradu.
This program is really a way to show off the abilities of the GNU Plot Utilities. This means that you need to have libplot installed and ready to link to. To get this library, have a look here: http://www.gnu.org/software/plotutils/plotutils.html
![]()
| Return to Main Page *** Return to Program Page |
|
This page was created with only free, open-source, publicly licensed software.
This page was designed to be viewed with any browser on any system. |
| Chris X. Edwards ~ May 2002 |