I was doing some work on tire dynamics while planning a vehicle physics engine. In the course of that project I wanted to visualize some triangles. Easy right? If you saw my previous post about learning Blender you’d think that would be especially easy for me. But strangely, it was not.
In Blender you can make an equilateral
"circle" with 3
sides. You
can
make an icosahedral sphere (made of triangles) or a triangular
fan or a cone made of triangles. You can create triangles out of
rectangles with quads_convert_to_tris() or poke() and then delete
the triangles you didn’t want. But simply generating a lone arbitrary
triangle is weirdly hard to achieve. It is weird because from a
computer science standpoint, 3d computer modeled geometry is composed
only of
triangles.
How about three 2d lines? Amazingly, no. Blender is also not at all ideal for modeling a simple pair of endpoints connected by a line. Weird, right? I was actually so blown away to learn this that it kicked off an odyssey of heroic software engineering designed to sort this out once and for all. That odyssey is today’s story!
I had been working on learning the arcane art of controlling Blender with Python. That topic was exactly as confusing and muddled as I expected for such a baroque piece of software. But doable. And speaking of baroque, after some experiments with Blender’s Python console, I started to have a dangerously stupid idea…
It turns out that I, Chris Edwards, have written a geometric modeler. It is called GeoGad, short for Geometry Gadget. I started this project in 2004 and until about 2014 it was really only a programming language. Yes, that’s right, a programming language. A delightful Turing complete bad-ass programming language that I’ve used pretty much every day since 2004. I know it’s bad-ass because it was heavily inspired by HP calculator RPL and if you think that was not bad-ass, you’re an idiot.
The GeoGad logo is a triangle. And yes, GeoGad’s mascot is a sloth (Motto — Slow but happy and lovable).
In 2014, I added the geometry model and its functions to the language.
In my system, geometry can only consist of simple lines and
triangles. The lines are visible and the triangles exist only to
provide occlusion reference i.e. allow for hidden line removal. And
that hidden line removal was done by a Unix command line rendering
engine called to2d. That C++ program is the most obscure rendering
engine in the world because I wrote that too. While developing the
geometry capabilities of GeoGad, I would pipe the raw geometry model
to to2d and then dump the resulting 2d vectors in a file formatted
as SVG. I could have a browser constantly polling
and reloading this output and there was a display system.
But that was not very user friendly, even for users like me who
have different ideas about what friendly means.
At this point in the story:
-
I wanted to do some simple geometry that is overly complicated in Blender and which GeoGad is especially good at.
-
I was playing around with Blender’s Python interpreter.
-
GeoGad is written in Python.
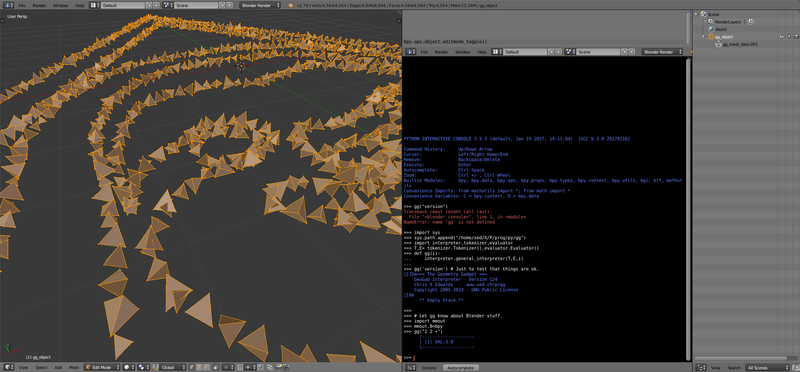
Hmmm…… Could I maybe run GeoGad inside Blender? It turns out, the answer is yes! Check out this screenshot.
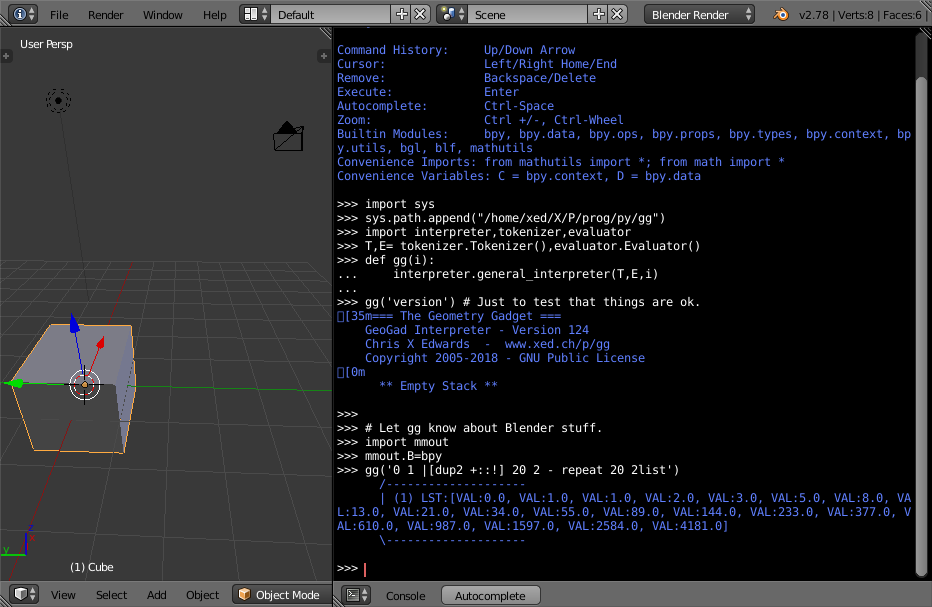
This shows how I tell the Blender Python interpreter where GeoGad
lives by editing the sys.path variable. Now this Blender Python can
import the important components of the GeoGad system (you can see
these
exact components in a similar project,
dated 6 years after mine, by Peter Norvig,
Google’s Director of Research).
With GeoGad’s code ready to run there was just one problem — the
Blender Python interpreter did not implement the Python input
command. This means I couldn’t just run GeoGad interactively like I
normally do. It may be possible to hook up interactive input to some
GUI element, but for now I simply define a function gg() that takes
as input a string of GeoGad code. And it’s ready to use! I start by
running the GeoGad version command to demonstrate that everything is
hooked up.
The next couple of commands import GeoGad’s memory model output code. If I’m running a text only version of GeoGad, I don’t ever need to send the memory model (the geometry) anywhere special. But the real point here is to actually control Blender. So this passes a hint to the output code about where it can use Blender functions.
And finally, I demonstrate a classic programming language test.
0 1 |[dup2 +::!] 18 repeatCan you figure out what that complete GeoGad program does? The answer and a nice comparison to other languages can be found here.
I’ve been making this look easy, but in reality, this has been a real grind. The first obstacle was that Blender, sensibly, uses Python3. In 2004 there was no Python3 and I took this opportunity to convert the entire GeoGad code base from Python2. The next ordeal was figuring out Blender’s interface functions and what might work. Blender uses a list of points and refers to them by their position; I use a dictionary of points and refer to them by numeric ID. My way allows everything to work without changes if some points are removed from the collection. The funny thing is that both ways are the same until some points are removed. I spent quite a while figuring that out while sometimes it would work and sometimes I would get a Blender seg fault.
Once I had added a blender command to GeoGad that could reliably put
GeoGad’s geometry into Blender, it was time to start writing some
stuff in GeoGad to do that. I quickly got sidetracked wishing GeoGad
had Vim syntax highlighting. So of course I worked on that. Once I had
rough highlighting finished, I was so
delighted by it I went through GeoGad and added color to the runtime
interpreter. It looks great! I’m loving that new feature but
annoyingly, the Blender Python console just makes a mess of it. So I
had to go back and make the colors optional. You can see some of that
mess on the version string which I haven’t yet fixed.
Here’s an example of a GeoGad program showing off the syntax highlighting.
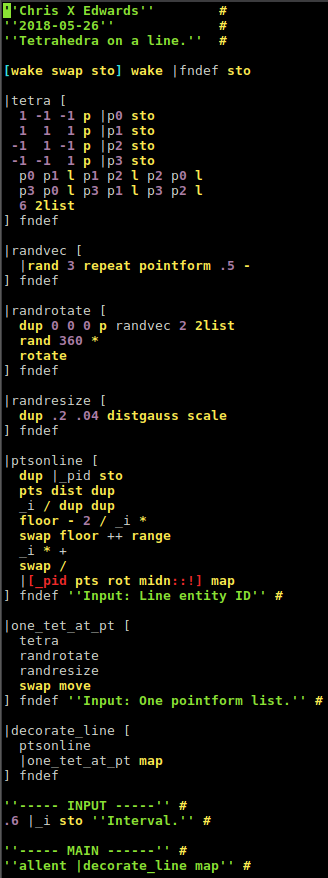
Even though some of the highlighting is not quite right (p0 should
be white, not mixed colors) it is already a huge improvement for me
and immensely helpful.
What does this code do? Since I was frustrated about triangles, I
decided to make tetrahedra. So the function (GeoGad thinks of it as a
live list stored in the symbol table, but same thing) tetra makes a
tetrahedron’s geometry. Then there are some functions to randomly
rotate and scale something (the tetrahedron presumably). The function
ptsonline calculates points on a line that are evenly spaced at the
interval _i (i.e. 0.6 as shown). What this allows me to do is send
some lines and replace them with a trail of random tetrahedra.
Another program that I worked on (but won’t bore you with) takes the SVG logo shown above and extracts the geometry (check this HTML page’s source to see it) and builds a GeoGad model with it. By feeding this set of lines to the program shown above, I get the following result.
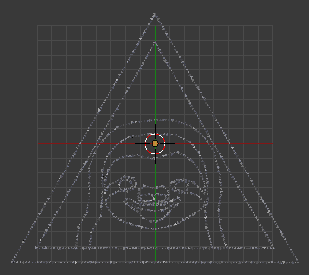
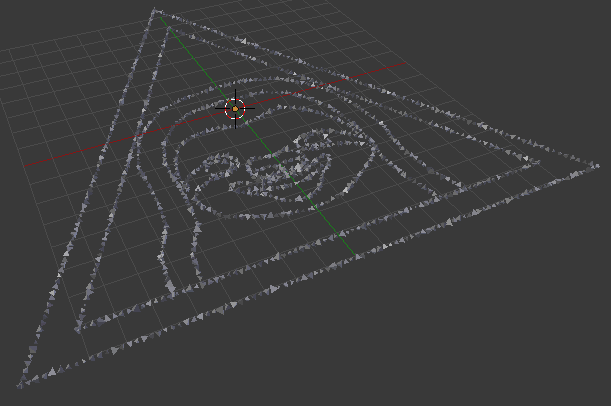
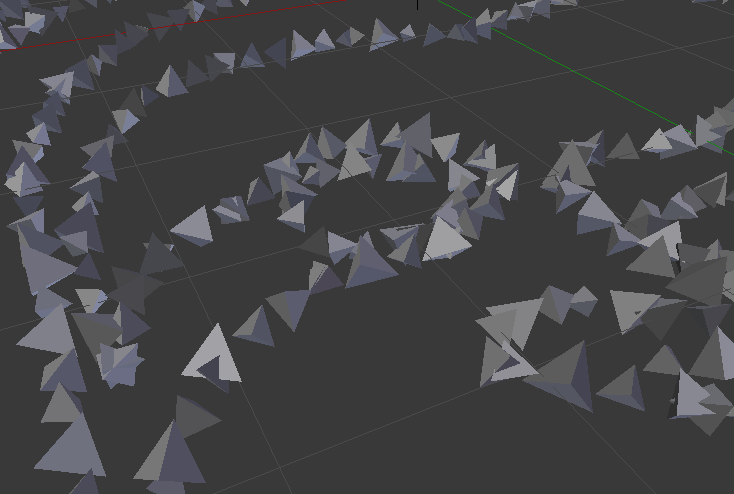
That is a superb result! I’m delighted with how perfectly GeoGad’s strengths compliment Blender’s. A lot of times when I model something I want a bunch of reference lines that clearly lay out geometric constraints and known geometry that must be designed to. I generally am less concerned with how it looks and more concerned with how it is. GeoGad helps me feed Blender explicit data that adheres to hard constraints. If there’s latitude in other parts of the modeling process to sculpt something to look nice, great, that’s what Blender excels at. Having Blender and GeoGad working together is really the best of both worlds for me.