Between the good old days of the Apple]['s
hgr and pretty
recently, just plotting a line on a computer screen was absurdly
complicated. It was like one of my most important computer
functionalities was lost for 25 years! In desperation, in 2002 I even
personally wrote a C program called gradu ("graphics dump") that
took text input using a custom flexible grammar, from a Unix stream
for example, and plotted vectors using the
GNU plotutils library.
But folks, those dark days are gone! Rejoice!
There are tons of superb resources and excellent official documentation. Here are my SVG notes and my post on using Unix and SVG to make pie charts.
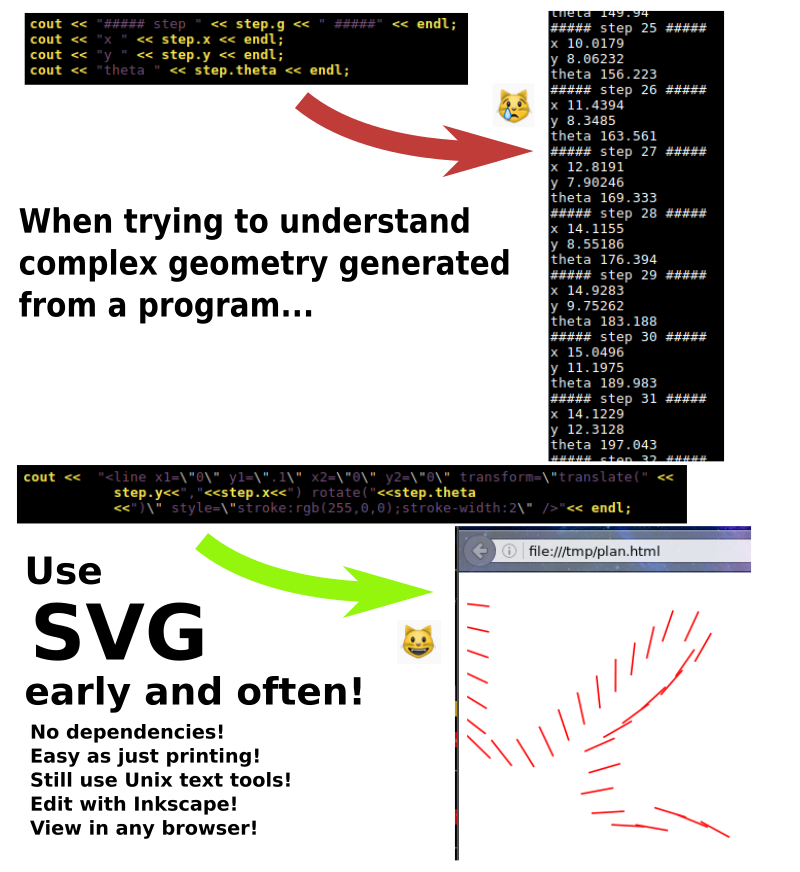
(Yes, I know that the SVG in the example graphic is lame, but that makes the point—I schlocked that to produce a graphical output with almost no effort at all. If that program had been designed with SVG in mind, it’d be even better and easier. And yes, I could have made that graphic entirely out of SVG. But that’s another important point—you can do that, or not. You have complete flexibility.)