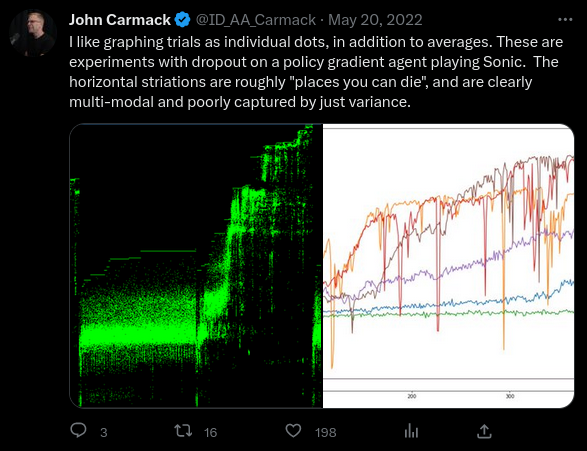
DNS Belabored - Plus Fast Unix Dot Plotting
:date: 2019-02-13 22:03 :tags:
Last weekend I ventured into some light DNS research. I wrote some scripts that did some look ups and I showed a bunch of confusing numbers and I really didn't have anything super interesting to say about it. Don't get your hopes up or anything because I don't think the topic has any really interesting surprises, but I did want to finish learning what I could learn.
For the last few days I've been running my look up script every once in a while, this time doing 1000 name lookup operations for each DNS server on my list (yes, there may be others, but I don't know much about them). Now I have a collection of 5000 random look ups for each server trying to resolve a random three letter domain name, 7/8 of which are ".com" and 1/8 ".org". Surely that is enough data to say something useful.
In my last post I pretty much left it with this.
I'm also a bit surprised to find the standard deviation of the look up times to be huge. What's going on there? Hard to say. I may do some more analysis on that...
This is still true and I feel like this is the most interesting thing. My desire to understand this data led me to research how best to visualize it. Back in the surreal part of my life where I dealt with biotech people, I got to see a lot of plots of the average with an "error bar". Here's a typical one from a paper which cites the lab I used to work for.
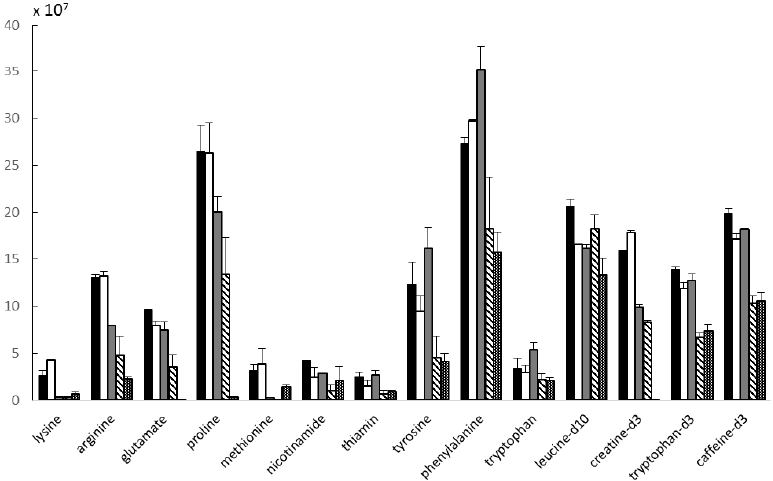
Now I have to be honest, I never understood just how those error bars truly related to reality and I always secretly suspected that they did not! This particular example, plainly states that it is simply a "standard deviation of the mean" but it's not always so clear. Long time readers with extraordinary memories may recall that I have taken a very keen interest in the philosophical foundation of modern statistical thinking. (Spoiler alert! — they range from circular to turtles to non-existant!) Here's a typical review I wrote in 2012. And another and another, etc. So you can imagine how delighted I was to find that in today's XKCD, the brilliant Randall Munroe illustrates my misgivings with crystal clarity. Check it out.
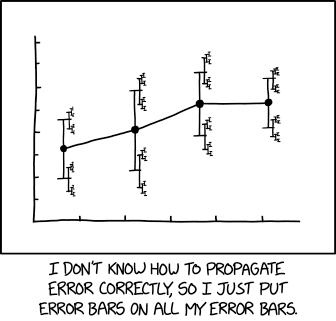
That is exactly the problem with this kind of plot. (Another nice presentation of the problem.)
Ok, so how should one present such data? I came across this interesting perspective called Beware Of Dynamite Plots from a biotech guy, Koyama. He advocates just plotting all the data. I think his points are well made and biotech people would be well-advised to carefully think about his message.
However, for computer nerds things might be a bit different. Koyama is rightly concerned about a paucity of data which is typical with life science wet lab experiments. I, on the other hand, easily collected a data point for each of 75000 experiments before I simply got bored with the process. I do like the idea of showing that data though. I could pop that in Excel, but only new Excel because before 2007 it wouldn't fit (so I'm told — I'm not exactly a user). You can imagine that experiments like I'm doing could have billions of data points. If they involve high speed network traffic or disk writes or something this could require some very high-performance methodology.
Wanting to show all the data I could, I decided to write a program that takes a Unix data stream (or data in a file or collection of files) and simply plots a pair of numbers to an image. That's it. Wanting it to be very fast and efficient and only requiring 14kB of disk space, I wrote it in C.
What kind of interesting output can I get with such a sharp tool?
I first organized the data I collected to be in this form.
.dnsdata
1 249
3 69
10 122
6 35
10 1512
13 40
9 626
6 132
12 262
4 252
The first field is the number of the DNS service I want to test. For example, 4 is Google's 8.8.8.8 and 6 is Cloudflare's 1.1.1.1. The second column is the time in milliseconds it took to look up a randomly snythesized domain.
The great thing about Unix is that you can pipe things to and fro and this allowed me to use awk to get the data scaled properly for the plot. Other than that, I just piped it to my program like this.
awk '{if ($2<4000) print $1*31 " " $2/4}' dnsdata | ./xy2pngHere I'm throwing away all data greater than 4000ms (4 seconds!) because that's into some weird stuff that probably should be ignored. I scale the first field up by 31x to distribute the servers across the plot's X axis and scale the times down by .25x (1/4th) to make sure 4000ms fits on a 1000 pixel plot.
And here's what we get.
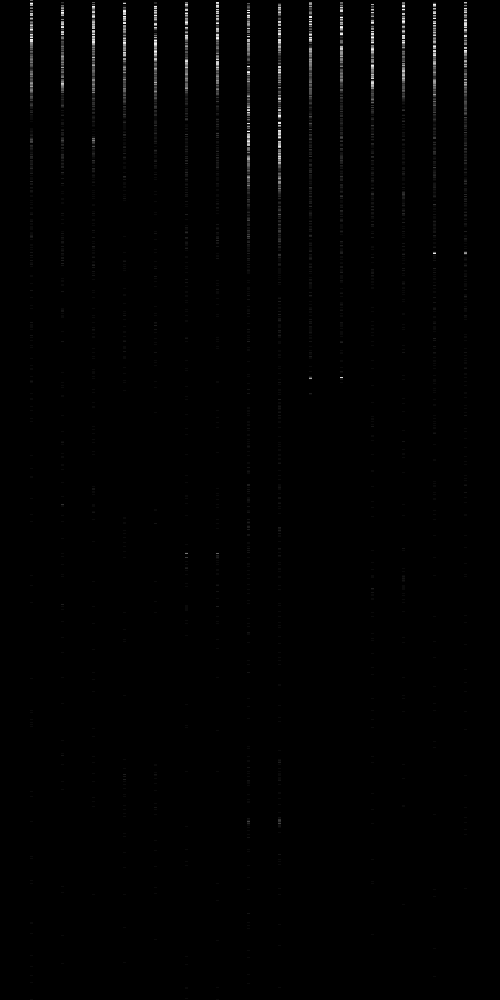
I left that image raw so you can see the kinds of images my xy2png
program produces. Zooming in to look at only results that came back
within a half second (500ms), and then dressing it up in post
production, I get something like this.
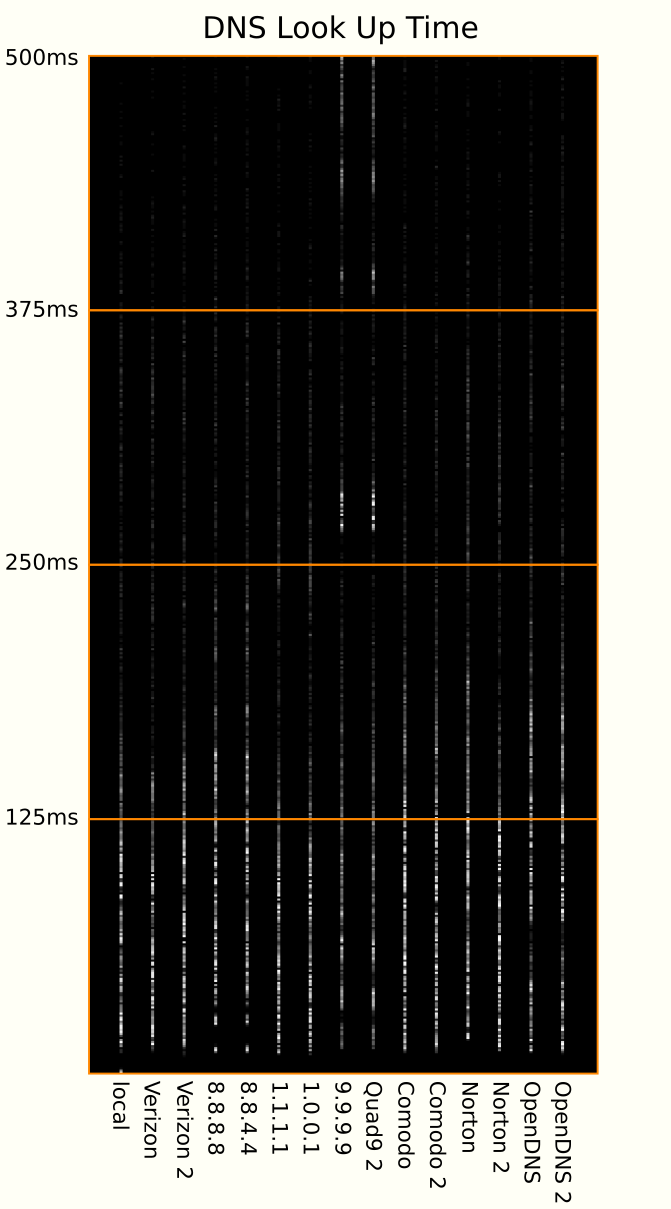
Note that the left-to-right order was the same in the previous plot but I inverted the Y to make it more customary — increasing values usually go up.
I feel like this plot is finally starting to give some sense as to what the subtle differences are in these services. For example, where average and standard deviation would have been confusing, we can easily see that Quad9 has some serious problems. Google has some odd glitches where it looks like they return something very quickly (cached?) or the next fastest lookup regime is relatively slow. OpenDNS has some snappy lookups but the bulk of their results are definitely slower than the others. If for some weird reason you like Norton the plot makes it clear that going with their secondary name server is the better bet.
The most interesting and practical result of this detailed analysis however is how Cloudflare's excellent performance is clearly revealed. 1.1.1.1 and 1.0.0.1 are clearly the best name servers, clearly beating both omniscient Google and Verizon's privileged network (as my ISP).
Set your DNS servers confidently to 1.1.1.1 and 1.0.0.1 and if you have an analysis that needs a bajillion points plotted in a serious hurry keep my Unix/C technique in mind.
.xy2png.c [source,c]
#include <stdio.h>
#include <stdlib.h>
#include <string.h>
#include "png.h"
#define MAXLINELEN 666

void process_line(char *line, png_image i, png_bytep b) {
    const char *okchars= "0123456789.-+|, "; /* Optional: "eE" for sci notation. */
    for (int c= 0;c < strlen(line);c++) { if ( !strchr(okchars, line[c]) ) line[c]= ' '; }
    const char *delim= " |,"; char *x,*y;
    x= strtok(line, delim);
    if (x == NULL) { printf("Error: Could not parse X value.\n"); exit(1); }
    y= strtok(NULL, delim); /* When NULL, uses position in last searched string. */
    if (y == NULL) { printf("Error: Could not parse Y value.\n"); exit(1); }
    b[atoi(y) * i.width + atoi(x)]= 255;      /* Compute and set 1d position in the buffer. */
    /* if (verbose) printf("%d,%d\n",x,y); */
}

void process_file(FILE *fp, png_image i, png_bytep b){
    char *str= malloc(MAXLINELEN), *rbuf= str;
    int len= 0, bl= 0;
    if (str == NULL) {perror("Out of Memory!\n");exit(1);}
    while (fgets(rbuf,MAXLINELEN,fp)) {
        bl= strlen(rbuf); // Read buffer length.
        if (rbuf[bl-1] == '\n') { // End of buffer really is the EOL.
            process_line(str,i,b);
            free(str); // Clear and...
            str= malloc(MAXLINELEN); // ...reset this buffer.
            rbuf= str; // Reset read buffer to beginning.
            len= 0;
        } // End if EOL found.
        // Read buffer filled before line was completely input.
        else { // Add more mem and read some more of this line.
            len+= bl;
            str= realloc(str, len+MAXLINELEN); // Tack on some more memory.
            if (str == NULL) {perror("Out of Memory!\n");exit(1);}
            rbuf= str+len; // Slide the read buffer down to append position.
        } // End else add mem to this line.
    } // End while still bytes to be read from the file.
    fclose(fp);
    free(str);
}

int main(const int argc, char *argv[]) {
    png_image im; memset(&im, 0, sizeof im); /* Set up image structure and zero it out. */
    im.version= PNG_IMAGE_VERSION;           /* Encode what version of libpng made this. */
    im.height= 1000; im.width= 1000;         /* Image pixel dimensions. */
    png_bytep ibuf= malloc(PNG_IMAGE_SIZE(im)); /* Reserve image's memory buffer. */
    FILE *fp;                                /* Input file handle. */
    int optind= 0;
    if (argc == 1) {                         /* Use standard input if no files are specified. */
        fp= stdin;
        process_file(fp,im,ibuf);
    }
    else {
        while (optind<argc-1) { // Go through each file specified as an argument .
            optind++;
            if (*argv[optind] == '-') fp= stdin; // Dash as filename means use stdin here.
            else fp= fopen(argv[optind],"r");
            if (fp) process_file(fp,im,ibuf); // File pointer, fp, now correctly ascertained.
            else fprintf(stderr,"Could not open file:%s\n",argv[optind]);
        }
    }
    png_image_write_to_file (&im, "output.png", 0, ibuf, 0, NULL); /* PNG output. */
    return(EXIT_SUCCESS);
}
Compile with this (order-sensitive).
gcc xy2png.c -o xy2png -lpng
Might also need sudo apt install libpng-dev.
UPDATE 2022-05-20
♥ ♥ ♥
